Technical Notes
This page has additional information about any significant design changes that are made.
Persistence Check for zero-crossing (Dec 2014)
Update Feb 2016:
The persistence mechanism described below was introduced to improve the performance of the logic which detects each new mains cycle. I have since found that the output waveform can be disturbed by the transformer going into saturation when it is only very lightly loaded. This unhelpful effect can be avoided by lowering the values of the resistors which reduce the amplitude of the AC signal.
Reducing the values of R4 & R5 to 100R & 1K0 (from their previous values of 10K & 100K) appears to provide sufficient loading. I have only noticed this effect with the 9V transformer, but intend to supply these lower valued dropper resistors for use with both transformer variants from now on. Because of the thermal dissipation, the larger of these two resistors may need a 1/2 Watt rating.
With these lower valued resistors in place, the persistence mechanism is probably not serving any useful purpose, but it's not doing any harm. By setting the persistence value to zero, this mechanism will have no effect. In most sketches, this parameter is called PERSISTENCE_FOR_POLARITY_CHANGE.
Fundamental to the Mk2 Router's design is the need to know when each new mains cycle has started. By means of a low-pass filter, the mid-point of the stream of voltage samples from the ADC is determined. Each new voltage sample is compared against this value and found to be either above or below the mid-point. The polarity of each sample is thereby declared to be either positive or negative.
Whenever a sample with positive polarity follows one with negative polarity, a new mains cycle is declared. This simple mechanism makes no allowance for 'noisy' or 'multiple' crossings. However, as no problem has ever been noticed, the original version has never been changed.
The new (green) PCB allows the processor to be operated at either 3.3 or 5V. When operated at the higher voltage, it makes sense to use a transformer with 9V secondaries rather than 6V. When testing the new transformer, I found that the number of sample sets per mains cycle was not entirely consistent, and this effect appeared to be caused by multiple crossings of the voltage waveform. {I now believe there is a different reason, as explained at the top of this page}
A 100nF capacitor soldered across the secondary output of the transformer appeared to have some benefit. A less intrusive workaround was to add some persistence to the zero-crossing detector within the software. By setting the 'depth' of persistence to 2, each zero-crossing event was only declared after two consecutive samples had been recorded in the 'other' half of the waveform, and the problem went away.
To monitor this situation, I arranged for the code to note the number of sample sets during each mains cycle and to display the lowest value via the Serial Monitor every few seconds. For most of the sketches on the Downloads page, samples occur in sets of 3 with 125 μs between each sample, so the expected number of samples sets per mains cycle is 53.33. Any displayed values that are lower than 53 are a cause for concern. {20,000μs / (125μs * 3) = 53.33}
The above mechanism has been applied to the basic Mk2_bothDisplays sketch (v2 → v3) and also to the Mk2_multiload_CAT5 sketch (v3 → v4).
When I came to update the Mk2_withRemoteLoad sketch, I found that the amount of persistence needed to be slightly greater. This time, the 'depth' setting needed to be at least 3 to prevent spurious values from being seen. This difference disappeared if the RF transmissions were disabled. It therefore seems likely that RF transmissions are causing some degree of disturbance to the ADC operation.
The Mk2_withRemoteLoad sketch was similarly upgraded (v3 → v4) but with the persistence value set to 3 rather than 2.
The Mk2_RFdatalog sketch has been treated differently, as explained below.
Code Restructure and Temperature Measurement (Dec 2014)
To date, all Mk2 sketches on this website have shared the same basic structure. The ADC has been controlled by a hardware timer, and a minimal amount of work has been done within the Interrupt Service Routine (ISR). Most of the work has been done by the main code, in loop(), or in its various helper functions.
That arrangement is fine for the basic operation of the router, but complications arise when additional activities are to be performed such as temperature measurements. The OneWire protocol that is used for the Dallas sensor operates too slowly to fit within this kind of structure.
To solve this problem, a revised version of the Mk2 code has been produced such that all of the activities with critical timing are processed within the ISR. This includes the acquisition and processing of all ADC data and the controlling of any wired loads. Any slower peripheral activities are dealt with by the main code. This includes Serial statements, RF transmissions and temperature measurements.
For this revised structure, the ADC is free-running with each A→D conversion taking ~104μs. At a 50 Hz mains frequency, there are approx 64 sets of samples per mains cycle: 20000μs / (104μs * 3) = 64.1 Using the detection mechanism described above, the minimum number of sample sets per mains cycle is reliably seen to be 64.
Mk2_RFdatalog_4.ino is the first sketch to use this new code structure. Some initial results from this sketch are available here
When using this sketch, the value 64 is seen even when the persistence for the zero-crossing detector is set to 1. Using identical hardware, the equivalent value of 53 is only seen with Mk2_withRemoteLoad_4.ino when the persistence setting is increased to 3. This suggests that the ADC is only affected by RF activity when controlled by a hardware timer. When the ADC is free-running, no such disturbance is seen.
The ISR is responsible for determining when each datalog activity should occur, and for providing copies of the necessary data for use by the main code. A 50 Hz 'tick' is also provided so that the main code can be aware of the passage of mains cycles. This mechanism is used by the main code to update the value to be displayed at the 4-digit display, every second.
To avoid any 'flicker', the rapid refreshing of the display is the responsibility of the ISR. As posted, the refresh rate is approx 80 Hz.
For measuring temperature, I have used a pair of custom routines that are available via the Open Energy Monitor website. For use with a single Dallas sensor, this approach is simpler than when using the standard library routines for which an additional header file would be required.
The temperature sensor can be connected to any free IO port. When the display and RF module are both in use, the only one that is available is the "mode" port. This situation is described on the Photo Gallery page.
Improved logic for controlling multiple loads (November 2015)
For versions 1 to 4 of the multiLoad code, the same simple approach has been used for controlling the state of the loads. To prevent multiple switching from taking place under certain conditions, a delay of 0.5 seconds has been imposed between the operation of different loads. Although the resulting performance is acceptable in most situations, this unrefined approach can give rise to complications in some circumstances.
Version 6 has a different approach. Rather than the single-threshold algorithm which was used for versions 1 to 4, Version 6 reverts to the twin-threshold scheme that can be found in most of my other sketches. (Version 5 did not work as intended so should not be used.)
As with all previous versions, knowledge is maintained of the "active load", this being the one that has most recently been switched. Also, as before, all other loads are prevented from switching during the period immediately after any transition of the active load. However, this delay is now very much smaller, only two or three mains cycles rather than half a second.
This improvement has been made possible because the energy thresholds are being more carefully maintained. During the period immediately after a load has been switched, any further movement of the energy bucket's level is noted and the relevant threshold is updated accordingly. This mechanism allows an accurate baseline to be established against which the level of the energy bucket can be subsequently checked with confidence.
After any decision to change the state of a load has been taken, there is a delay of approximately 10 ms before the switching actually takes place. During this period, the energy state of the premises will continue to advance in the 'wrong' direction. It therefore takes a couple of mains cycles before the effect of changing any of the loads can be reliably assessed. If the "active" load is unable to achieve the desired effect beyond this timescale, an additional load can now be brought into play much sooner than has previously been possible.
In some parts of the world, the presence of any exported energy causes a penalty flag to be set in the user's meter. Minimising the "dead" period between the switching of adjacent loads can be very beneficial in such environments.
Refinements to the ISR (January 2016)
Apart from the "RFdatalog" series from Version 4 onwards, all of my 'Mk2' sketches on the Downloads page operate in a similar way. The ISR arranges for a set of ADC samples to be taken, and the entire set is processed by the main code in one go. This approach has stood the test of time, and I have not seen any evidence to suggest that the original implementation is not working reliably in all cases.
While looking through the code, I have noticed two aspects that have not been implemented as tidily as they could have been. The four Mk2 sketches that are affected have therefore been updated as described below.
Working copies for ADC samples
For each of the original versions, only one 'int' variable was declared for holding each type of ADC sample (e.g. V_sample). This single variable was both read by the main code and written to by the ISR. While the main code was processing each set of ADC samples, there was no certainty whether the intended value would be read, or whether the next value would have already been written by the ISR. In practice, it would make little difference which ADC value was used provided that there was consistency from one set of data to the next.
In the upgraded code, an extra set of variables has been declared. Before the dataReady flag is set by the ISR, a full set of working copies is made available for use by the main code. These working copies will not change while processing is under way. Only the variables for the "raw" ADC data will change, and they are not visible to the main code.
In practice, the number of extra copies that is required is one fewer than the number of ADC sample streams. The "basic" single-phase Mk2 sketch, with 1 x V and 2 x I sensors, has 3 ADC channels in total, of which only two are vulnerable to being overwritten while processing of each data set is under way. The 3-phase version, with its six ADC channels, requires only five extra variables for ADC data.
Additional use of the "volatile" descriptor.
As mentioned above, the working copies of ADC data are written by the ISR and read by the main code. In all such situations, it is wise for these variables to be declared as "volatile". This prevents the compiler from applying optimisation measures which could lead to ill-defined behaviour.
Previously, the dataReady flag was correctly defined as "volatile", Now, the variables that hold working copies of ADC data are declared as "volatile" too.
∗ ∗ ∗
Thankfully, none of the above changes appears to have had any effect on the ability of these sketches to measure "real power". This suggests that the original code was working as intended although the implementation was not as robust as it could have been.
Upgrade to the LPF for removing the DC from AC voltage samples (February 2016)
From the start of this project, a Low Pass Filter (LPF) has been used to remove the DC component from the AC voltage samples. For each V-sample that is generated by the Analog To Digital Converter (ADC), the mid-point of the waveform is subtracted to leave just the AC content. These 'filtered' sample values are accumulated throughout each mains cycle. Whenever a new mains cycle is detected, a portion of the accumulated total is used to adjust the mid-level point. By this means, the DC level is continuously adjusted to lie at the mid-point of the stream of voltage samples.
When the Mk2 Router was first posted on the Open Energy Monitor forum in 2012, it used Floating Point maths. For convenience, the portion that was fed back into the LPF was set to 0.01 or 1/100. Later, when integer maths was used, this was replaced by a shift of 26 so the feedback was then 1/64. Unfortunately, this feedback has never been based on the average offset during the previous mains cycle, as was intended. It has instead been based on the total offset of all samples during the preceeding cycle. With around 50 V-samples per cycle, the returned portion has therefore been about 50 times greater than was intended.
Although this amount of feedback within the LPF has been excessive, no adverse effect has ever been noticed at the macro level. The system has always been able to measure real power with good results. With a reduced amount of feedback, the performance can only be improved.
The fraction of the accumulated total that is fed back within the LPF has now been reduced across all lines of code from 1 in 26 to 1 in 212. This represents approximately one hundredth of the average offset value during the previous mains cycle.
With the reduced amount of feedback, the performance of the polarity detector is greatly improved. This trace is from a trial-version of the basic Mk2_bothDisplays code in which only the Vsample stream is being converted and processed. The reported polarity now changes right at the centre of the waveform; previously, the mid-point as determined by the LPF was moving around so small timing anomalies were seen at each of the zero-crossing points. With so little power at these parts of the waveform, such anomalies have had minimal effect on the overall behaviour of the system.
Near the start of this waveform, a single spurious value can be seen. I believe this to be due to the core of the lightly-loaded 9V transformer becoming saturated. Increasing the loading of the transformer, as described at the top of this page, can prevent this situation from occuring.
Improved Calibration (February 2018)
Using a known load for calibration purposes is of limited benefit. The power that is drawn by a given load is dependent on the mains voltage which can vary significantly during the day. For accurate calibration, access to some form of reference standard is needed.
The electricity meter, as installed in every premises with mains power, can provide a useful reference standard. Digital meters monitor the flow of energy by repeatedly measuring the instantaneous voltage and current. Such meters generally produce an optical pulse for every unit of energy that flows.
The Mk2 PV Router software monitors the flow of energy in a similar way. A variant of the standard sketch has been created which generates a logical pulse for every unit of energy that flows through CT1. By clipping CT1 around one of the 'live' cables adjacent to the meter, the router is exposed to exactly the same flow of energy as passes through the meter.
By varying the powerCal value for the CT1 channel, the rate of pulses that is produced by the Router can be adjusted . When the pulse rate from the Router is similar to that from the meter, correct calibration has been achieved. The same powerCal value can then be used with any Mk2 PV Router sketch which is to run on the same hardware.
Having calibrated the CT1 channel (with reference to the electricity meter), it can then be used as a transfer standard to calibrate the CT2 channel. By this means, accurate calibration of both measurement channels can be readily achieved.
This approach to calibration is described in more detail on the Improved Calibration page.
Faster Control Algorithm (February 2020)
With all Mk2 sketches to date, the energy state of the premises is updated every mains cycle. This occurs as soon as a change of polarity occurs in the AC voltage waveform. A decision is than taken regarding the new state of the load(s) but that decision is not implemented until the next zero-crossing point of the mains voltage. As a consequence of this delay, the load remains in the previous (i.e. opposite) state for an extra half mains cycle.
Certain types of electricity meter are particularly intolerant to reciprocating flows of energy. In such cases, it is beneficial to constrain the energy state of the premises as tightly as possible. A faster algorithm has therefore been devised which removes the half mains cycle delay mentioned above.
The energy flow at the grid-connection point is still monitored continuously, and the main energy accumulator (aka bucket) is still updated at the start of each new mains cycle. However, decisions about the new state of the load are no longer made using this "energy bucket" parameter. Instead, a prediction is made at the half-way point of each mains cycle as to the likely energy state at the end of that cycle approx 10 ms later. Based on this prediction, the load state can be changed half-a mains cycle earlier.
Using this new scheme, decisions about the load state can occur more rapidly. When the level of surplus power is 50%, the load can now cycle on/off every two mains cycles, i.e. one cycle on then one cycle off. With all previous implementations, the fastest behaviour that could be achieved was two cycles on and two cycles off.
With the "floating" CT arrangement that we use, the CT acts as a High Pass Filter. This causes the DC point to move to and fro as each mains cycle progresses. Data samples from the CT are however processed as if the DC point was constant. Although not evident during normal operations, the recorded power during the first half of each half-cycle (when the mains voltage is rising) is always under-recorded, and the second half is correspondingly over-recorded. This is a fundamental consequence of using a "floating" CT to monitor AC current rather than having a direct galvanic connection.
Whenever the load state is changed, the current at the primary CT immediately changes from export to import or vici versa. This causes a discontinuity to the normal oscillation of the DC point. As a consequence of this event, the power that is recorded during the first half mains cycle after each change of load state will be under-recorded by a significant amount. Measurements on the bench suggest that this factor could be at least 20%.
To accommodate this effect when using the "faster control" algorithm, the power that is measured during the first half mains cycle after each change of load state is boosted by a factor of 30% for the sole purpose of predicting the energy state at the end of the mains cycle. Each prediction is used just once and then discarded so there is no overall effect on the energy balance that is maintained between import and export.
Power Supply Stability (February 2020)
On my own PCBs which include a mains power supply, the primary smoothing capacitor (C1) has always been rated as 100uF. This value has provided satisfactory performance with all versions of the Mk2 PV Router. At times, I have even run two processor boards from a single DC supply.
When powering a 5V system from a "6V" mains transformer, there is not much voltage headroom. I recently encountered problems with a fully equipped 5V system. The final straw appeared to be when a second load was added as well as the display and an RF module. The problem was solved by increasing the value of C1 from 100uF to 220uF.
Before making this change, I noticed that the display was flickering slightly and the processor would occasionally reset. I believe these effects can both be attributed to excessive ripple on the output of the primary voltage regulator (VR1).
As a precaution, I will now supply the larger value of C1 for any 5V system. For 3.3V use, I believe the standard value of 100uF will continue to be satisfactory.
Faster Control Algorithm Updated (March 2021)
As noted above, my first attempt at a faster control algorithm involved a 30% boost factor which was applied immediately after any load had changed state. This simple workaround has allowed many Mk2 Router systems in France to work satisfactorily alongside their very sensitive meters. A better approach has since been found whereby the unhelpful behaviour of the CT acting as a High Pass Filter (HPF) can be offset in software.
The approach taken is to pass the raw output signal from CT1 though a digital Low Pass Filter (LPF) and add some amplification. The resulting filtered signal is then combined with the original unfiltered one. This technique can be demonstrated on a spreadsheet.
Blue - the original signal
Yellow - the CT's output with its inherent HPF distortion
Red - after passing the Yellow signal through a digital LPF with some amplification
Green - summation of the yellow and red signals
(NB. the green signal is largely obscured by the blue one)
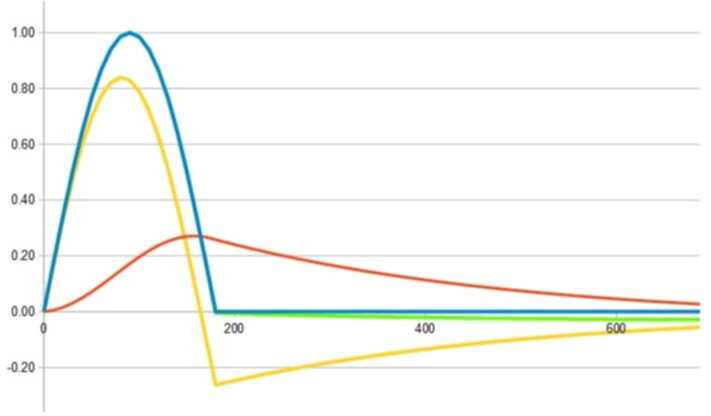
By using the same technique in the real world, the reconstructed signal can be a far better match to the original one than the unprocessed version. The two parameters which can be varied are the time constant of the LPF, and the amplification which is applied before the two signals are combined. Here are two real-life traces taken with and without this extra processing. In each case, current was flowing through the CT for just half of a mains cycle.
original waveform from the CT and with the extra processing
In the original (unprocessed) version, the recoil effect of the CT can be clearly seen,. This causes much of the waveform's power to be recorded in subsequent periods. The 30% boost factor which I introduced last year was my first attempt at compensating for this unhelpful effect.
In the processed version, the waveform's profile has been greatly improved. This new processing is intended for use with the YHDC SCT-013-000 CT and for a sample rate of 375 us as occurs in most of my Mk2 Router sketches. In any other situation, the parameters of the LPF would need to be adjusted for optimal performance.
The three variants of my fasterControl code all use the same predictive algorithm for controlling the load states. Each of these variants has been updated as described above. Previous versions of all sketches are available in the "Archived Versions" section of the Downloads page.
Faster Control Algorithm Updated (June 2021)
In the update of March 2021, new processing was introduced in which there were two new parameters with fixed values. The optimal values for those parameters was found by experimentation with a YHDC SCT-013-000 CT that I have been reliably using for some years.
It has since become apparent that more recent versions of the same CT behave in a slightly different manner. When using a recently manufactured device, better performance is obtained if the value of lpf_gain is reduced from 12 to 8. All three versions of my fasterControl code have therefore been updated in this way.
The test program which allows these parameters to be investigated is RST_375us_dev which is now available from the Downloads page.
Transformer Compensation (July 2021)
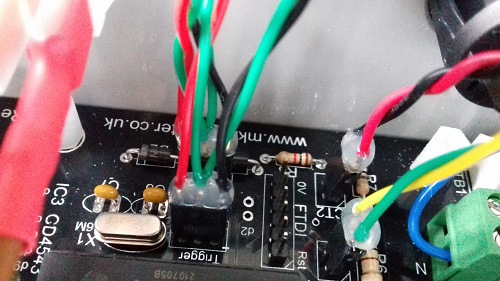
The 1-phase Mk2 PV Router control board has a single mains transformer with two secondary outputs. One output provides a low-voltage replica of the AC mains voltage; the other output provides a DC supply for the processor. Although the power consumption of the Atmel 328P processor is fairly constant, it will increase whenever an output stage is activated. Because of the way that transformers behave, any increased consumption from one secondary winding will cause the amplitude of the AC signal from the other one to decrease slightly.
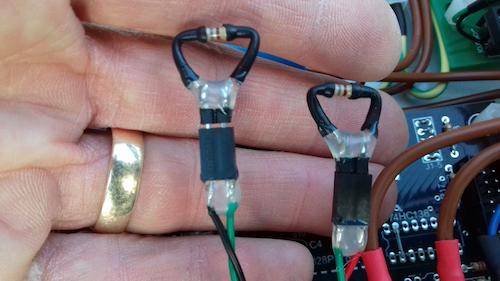
In most situations, this source of error will not affect the overall performance. But for use alongside meters that are particularly intolerant, an easy workaround is possible. From the same port as is used to drive the output stage, a second LED can be connected to the opposite power rail via a suitably rated series resistor. By this means, a similar amount of current will be drawn from the DC supply when the output stage is in either state. Alternatively, a resistor could be used on its own without an LED.
A test sketch Transformer_Checker.ino is now available from the Downloads page. This sketch can be used to quantify the reduction in the measured AC voltage when the output stage is activated. The displayed values are the measured RMS voltages when the output stage is off and on, and their ratio. For this application, only the ratio is important so voltageCal has been left at its default value of 1.0
These results are for a typical 3.3V 1-phase Mk2 PV Router without any compensation:
269.59, 267.99, 99.41%
269.54, 267.84, 99.37%
269.43, 267.79, 99.39%
These results are for the same hardware but with a compensating LED and a 100 ohm series resistor:
267.93, 267.65, 99.90%
267.97, 267.61, 99.86%
267.95, 267.65, 99.89%
And here with a compensating LED and an 82 ohm series resistor:
267.47, 267.59, 100.04%
267.61, 267.62, 100.00%
267.58, 267.70, 100.05%
Other ways of minimising this unwanted effect (by reducing the current that is drawn by the output stage) include:
- increasing the value of resistor R1 on the output board;
- increasing the value of the series resistor for the LED which indicates the load state;
- using the low-power MOC3043 opto-isolator rather than the standard MOC3041 device.
The same approach could be taken with 3-phase systems but less compensation would probably be needed
because of the more robust DC power supply.
Alternative current transformer type (August 2021)
For the 1-phase Mk2 Router, a second CT can be added to monitor the amount of energy which is sent to the dump-load(s). CT2 is normally a (red) YHDC TA17L-04. This "bobbin" style CT can be easily incorporated into the fixed wiring within inside the enclosure. It has a turns ratio of 2000:1 and is rated at 20A so is suitable for monitoring surplus power up to ~5kW.
The TA17L-04 can be hard to find so I decided to try an alternative type. The (blue) DL-CT08CL5 has similar dimensions and DC resistance and appears to provide similar performance. For the purpose of monotoring the amount of diverted power, either type of CT should provide adequate performance. A clip-on CT such as the YHDC SCT-013-000 could also be used but it would take up more room inside the box.
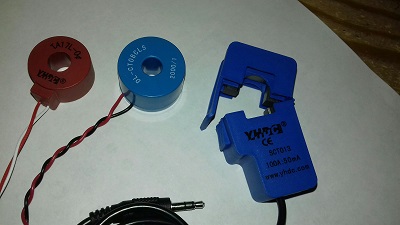
TA17L-04 "bobbin" (DC resistance ~135 ohms)
DL-CT08CL5 "bobbin" (DC resistance ~139 ohms)
YHDC SCT-013-000 "clip-on" (DC resistance ~99 ohms)
Here are the responses of these two "bobbin" CT types when fitted around the same live core of a 2kW resistive heater.
'1' - DL-CT08CL5 with a 150R burden resistor".
'2' - TA17L-04 with a 150R burden resistor".